
Bear Market Watch: What Smart Money Is Seeing in Bitcoin’s Data
Actionable Market Insights

Why this report matters
Bitcoin’s rally has stalled. Beneath the surface, key on-chain and derivatives signals that once fueled momentum are now fading. Institutional players are quietly tightening risk while retail traders remain trapped in breakeven limbo. Our proprietary models show this phase could determine whether the market resets—or reignites. Even with supportive macro trends and a strong equity backdrop, the data tells a different story. The real question now: are we witnessing another routine correction—or the first signs of a deeper turn?
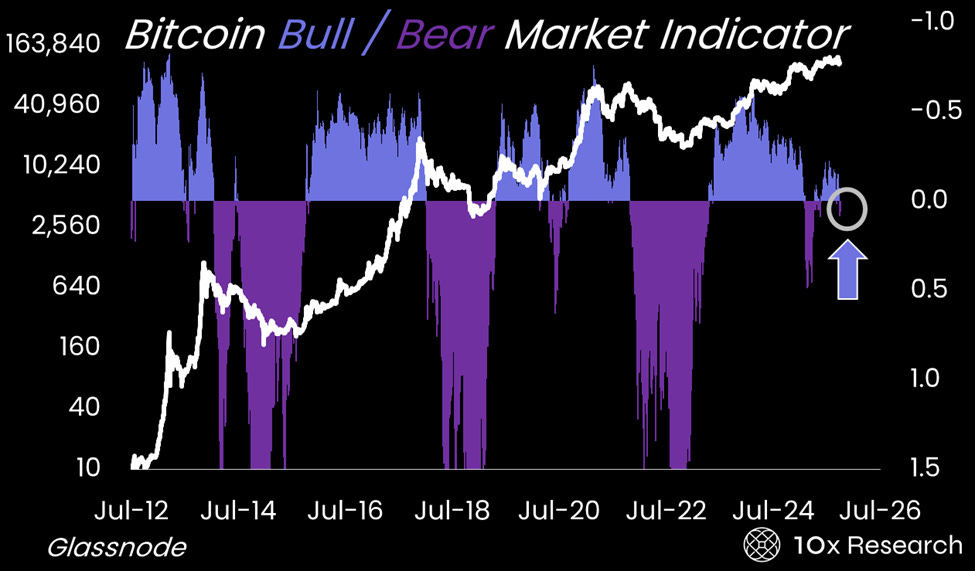
Bitcoin (LHS) vs. Realized vs. Market Cap momentum indicator (RHS)
Main argument
Ever since my time on the hedge fund desk at Goldman Sachs, I’ve been building models and tools to analyze market behavior. That continued when I moved to Morgan Stanley, where I led the Quant and Derivatives Strategies group in Asia, and later during my years in the hedge fund industry. What makes crypto so fascinating is that the kind of internal flow data once exclusive to institutions is now openly available on-chain. The challenge is no longer access—but interpretation: analyzing the data and developing indicators that reveal the underlying narrative or confirm a fundamental thesis. After several full market cycles, these indicators have proven invaluable in explaining the evolution of Bitcoin.
We have maintained a tactically bearish stance, anticipating a potential pullback toward $100,000. While short-term headlines drive volatility, our models show that Bitcoin is trading near critical historical levels that often mark shifts between bullish and corrective phases. Smart money continues to trade around these signals, utilizing structure and discipline, while those operating without guidance tend to fade each cycle.
See our recent reports — “Bitcoin: Knowing When to Bet BIG — and When Not to Bet at ALL” (October 16) and “The ONE Bitcoin Trading Rule That Separates Winners from Losers” (October 14) — for deeper insights into market timing and position management.