Bitcoin: Fade the Bounce - or Fade the Downtrend?
Actionable Market Insights

Why this report matters
There are two dominant trading approaches: reversal trading and trend trading. The most successful traders are not those who permanently stick to one, but those who know when to switch between the two, a skill that is far easier to describe than to execute.
When bullish or bearish trends reach capitulation levels, conditions often become ripe for reversal strategies. If that reversal then gains momentum and starts attracting fundamental and narrative support, price action can evolve into a new trend. This allows traders to transition from a short-term reversal position into a broader trend trade, having secured a strong entry and the ability to stay comfortably positioned as the trend develops.
Main argument
Trading reversals does not necessarily mean going outright long or short. It can also involve fading extreme, fully-priced scenarios, for example, when implied volatility is highly elevated because many market participants have already bought crash protection. This is precisely what we outlined in Monday’s Kickoff report and reflects the risk-reward profile of a post-correction normalization phase.
Implied Volatility has crashed
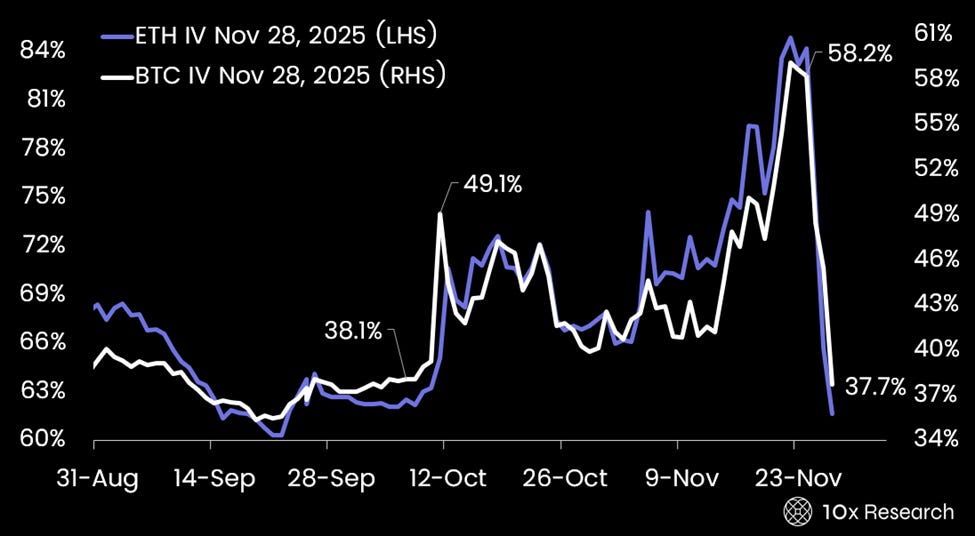
Bitcoin’s implied volatility for the November 28 expiry has now fallen below the levels seen when it made new all-time highs in early October. After trading around 58% on Monday, implied volatility has since collapsed by roughly 20 points, with December expiries also down about 8 points.
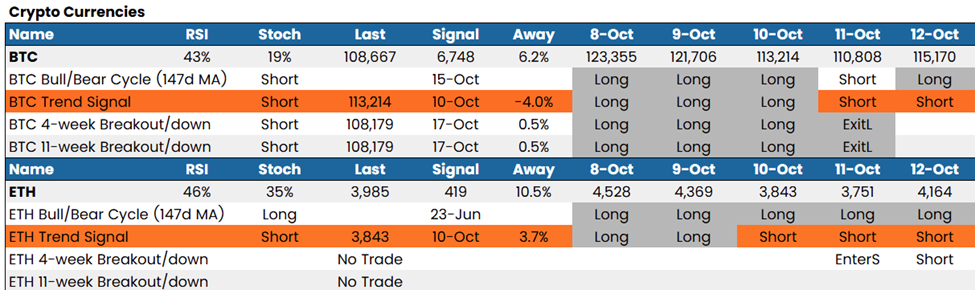
As we highlighted, our reversal and sentiment indicators had reached extreme levels where prices have often staged rebounds, even when broader downtrends remain firmly in place (here). Those trend regimes are tracked through our dedicated Trading Signals dashboard, which gives subscribers a clear, real-time view of prevailing bullish and bearish conditions.
Despite October’s reputation as Bitcoin’s strongest historical month, our models signaled that this cycle would be different when trend signals flipped bearish. Our Ethereum trend model turned bearish on October 10, with ETH trading at $3,843, and our Bitcoin trend model followed a day later as BTC rolled over toward $110,808.
Our Trading Signals dashboard - trend signal turned bearish on October 11