Bitcoin in April: The Timeline and the One Chart That Matters
Crypto market intelligence

Why this report matters
After five consecutive months of declines, matched only once during the 2018–2019 bear market, Bitcoin has finally posted a marginally positive month, gaining around 2%. Initially, we were cautiously constructive in March. While Bitcoin tends to perform better in April, those returns are skewed, but there is a notable relationship between how Bitcoin performs in April and the technical conditions it enters the month with.
In this report, we examine the key historical events in April that have shaped Bitcoin’s market direction, outline the most important dates to watch in April 2026, and assess how these catalysts could influence Bitcoin’s price path. We also highlight the single most important chart to monitor, the critical support levels that must hold, and the key trigger we are watching for the next major move. Are we simply aligning with historical averages, or is there a deeper, more actionable insight that traders should be watching?
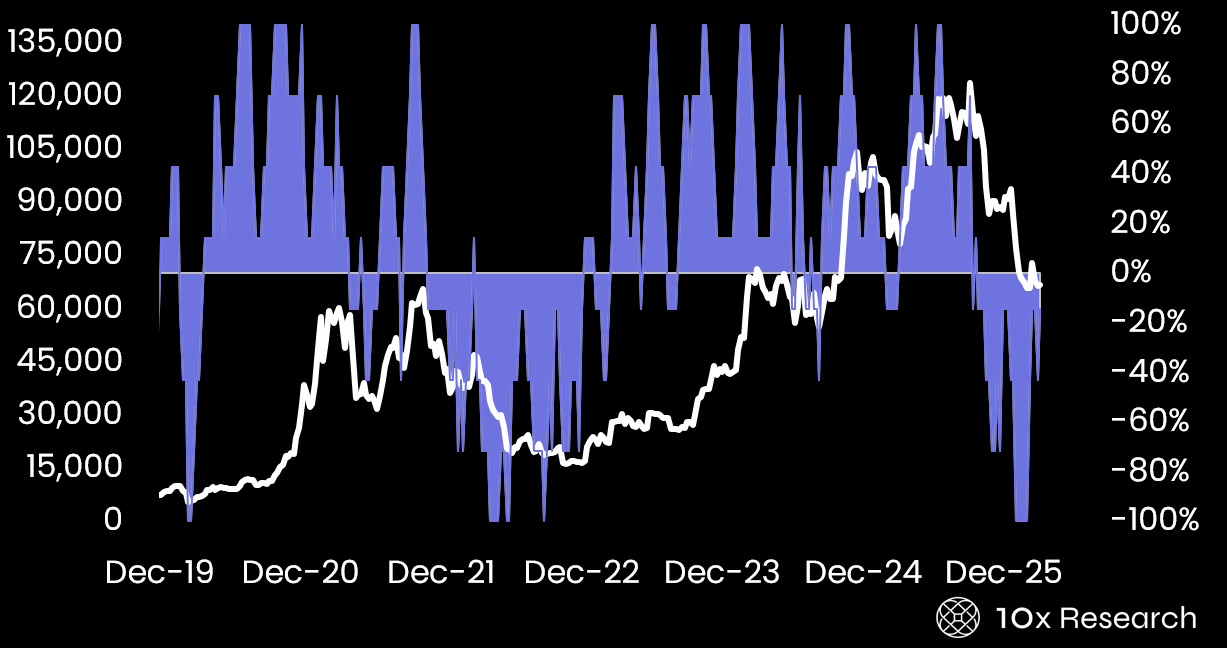
Bitcoin (LHS) vs. 10x Technical Composite Index (RHS, weekly data)