Bitcoin's Gravitational Centre: A Pattern Precise Enough to Scare You
Before the Consensus Catches Up

There is a pattern in Bitcoin’s price history precise enough to project cycle peaks and troughs to within days, not weeks, not months, across a decade of the most chaotic asset ever created. It has called every major turning point. It carries a specific target for the cycle low. It carries a specific date. And it raises a question that is either unsettling or extraordinary, depending on how seriously you take it: Did Satoshi design this deliberately?
The full analysis, the pattern, the targets, the date, and why a 5,000-year-old calendar may be the most important chart in crypto, is inside.
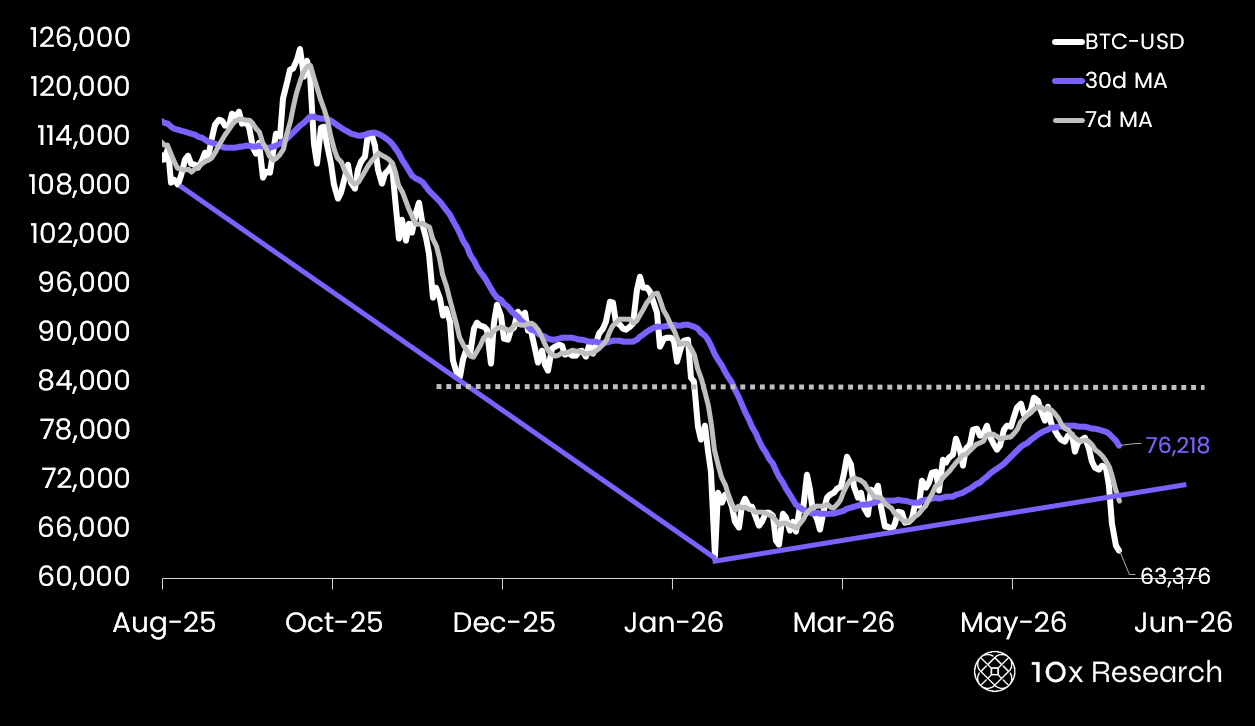
Bitcoin vs. its 30-day moving average