
Is Bitcoin Quietly Setting Up a Multi-Week Move? Here’s the Trade
Actionable Market Insights

Why this report matters
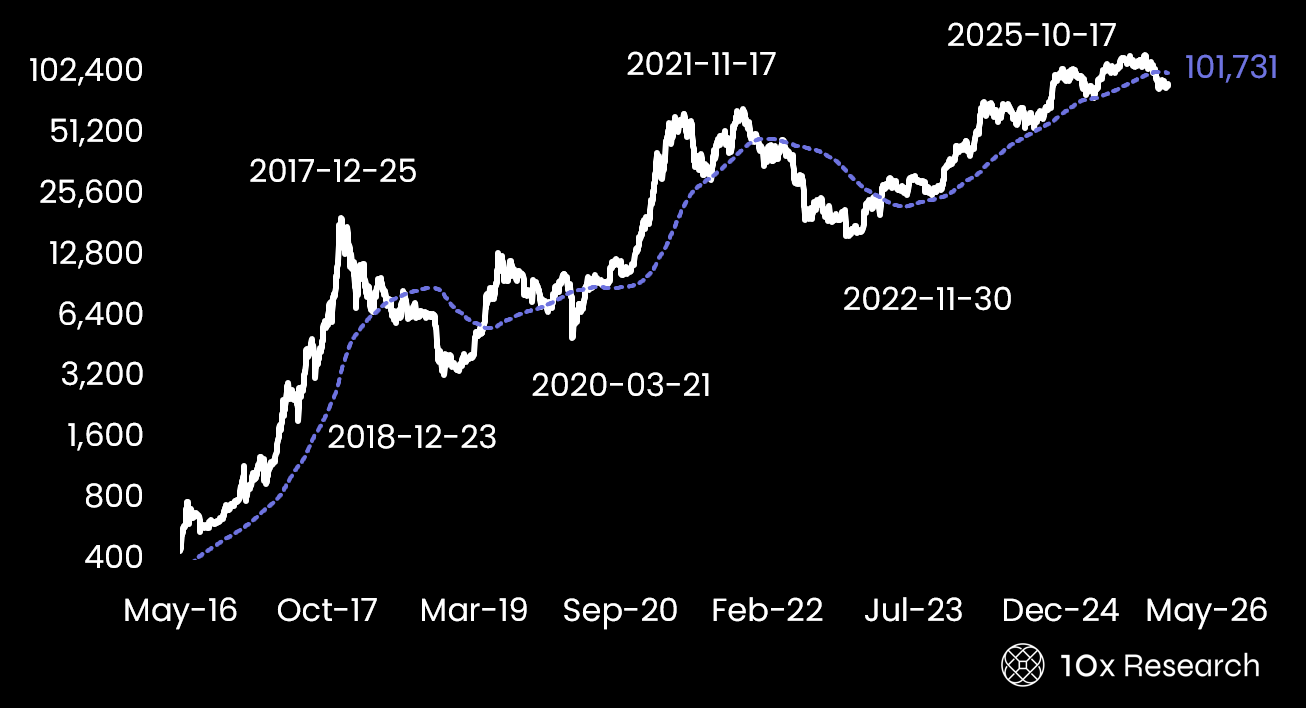
Bitcoin has spent weeks grinding sideways, frustrating both bulls and bears, yet the forces shaping the next move are quietly shifting beneath the surface. A rare alignment between options positioning, volatility compression, and technical exhaustion is beginning to emerge, conditions that have historically mattered far more than headlines.
Capital flows have been absent, not because opportunities have disappeared, but because the timing has been wrong. As year-end positioning gives way to fresh risk budgets, several overlooked signals are converging unusually. The market may be far closer to an inflection point than price action alone suggests.
Bearish Bitcoin Formation - but is this the correct set up to focus on?
Main argument
Since the October 10 Bitcoin crash, market structure has been meaningfully impaired, with Bitcoin ETF outflows accelerating after the hawkish October 29 FOMC meeting. By November 22, the initial sell-off appeared technically exhausted, yet a meaningful rebound failed to materialize, not because prices were unattractive, but because capital was not rotating into laggards. Instead, investors continued to reallocate toward the strongest-performing assets into year-end, leaving Bitcoin without additional support. But what are the charts and indicators to monitor for the next multi week move?