

The Bitcoin cycle didn’t break—traders just forgot what drives it.
Actionable Market Insights

This was originally prepared as a Strategy report, but given its importance to active allocators, we are sharing it here.
Why this report matters
Crypto is crowded with misleading narratives and surface-level analysis that lack statistical rigor yet spread quickly whenever they hint at overnight riches. Retail traders often get caught in this cycle, driven more by emotion than evidence. But beneath the noise, the market can be assessed quantitatively; it just requires proper data access, disciplined modeling, and independent thinking rather than hype.
Conceptual frameworks such as stock-to-flow and global liquidity overlays became deeply fashionable. Yet, none of them signaled selling anywhere near the last cycle peak—in fact, most doubled down as Bitcoin was already breaking lower. Now, the same voices insist the four-year cycle has “evolved” into a five-year one, rather than acknowledging their models failed at the exact moment they were needed. Below, we outline the only driver that truly explains the four-year rhythm, and examine whether it remains intact or has finally broken.
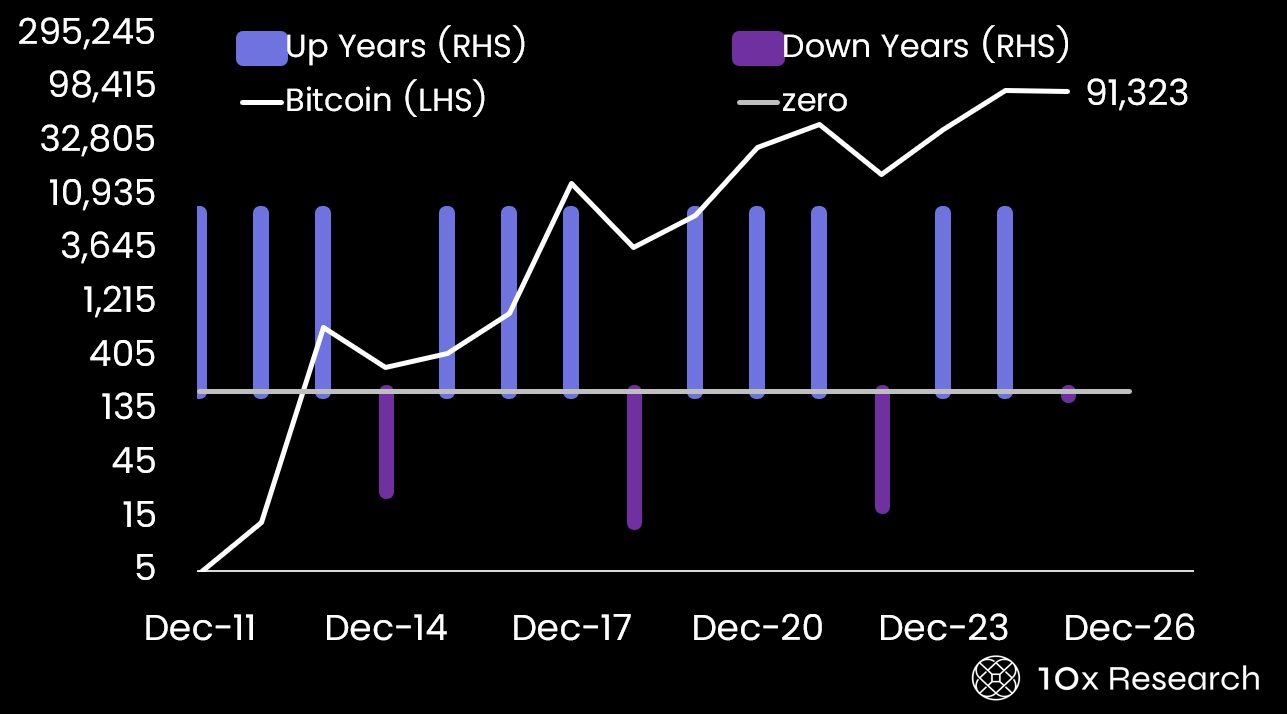
Bitcoin (LHS, log) vs. positive and negative years (RHS)
Main argument
In previous reports, we highlighted that the widely cited stock-to-flow model had already broken down during the last cycle (see the May 10, 2024, report). Instead of the near-constant 10x appreciation it projected as supply declined, Bitcoin delivered diminishing cycle returns of 560x → 108x → 21x → 4x, roughly one-fifth of the prior cycle each time.
This framework is why a $70,000 peak for 2024 was a realistic expectation, a level that did, in fact, cap price action from March until early November 2024, just before the post-election breakout. There is no mathematical law dictating that returns must compress by exactly one-fifth each cycle, but the stock-to-flow model clearly failed to serve as the infallible guide many believed it to be.
In this cycle, the popular “global liquidity drives Bitcoin” narrative only seemed convincing when the dataset was cut off at November 2023, and Bitcoin’s move was artificially lagged by 13 weeks. That 13-week delay has no theoretical or mechanical basis, and it assumes liquidity flows into Bitcoin linearly, which isn’t how risk-asset transmission works.
If you want to understand what actually drives Bitcoin’s cycle, and why next year could trap most investors, you’ll need to keep reading.