
Why Bitcoin Investors Should Trade the Cycle, Not Dollar-Cost Average
Before the Consensus Catches Up

The same playbook that works for the S&P 500 is destroying capital in Bitcoin. Understanding why changes how you allocate.
We have made three public, timestamped market calls since 2022: the October 2022 cycle bottom, the July 2023 projection of a $125,000 target, and the October 2025 bear signal, each grounded in the same signal framework. The methodology is not infallible. But it is systematic, auditable, and structurally better suited to Bitcoin’s cyclical nature than the passive approach most advisors currently deploy.
Dollar-cost averaging (DCA) is one of the most sensible strategies in traditional finance. Spread purchases over time, smooth out volatility, and avoid the psychological trap of market timing. For equities and bonds, assets that grind higher with the economy over decades, it is close to optimal for most retail investors.
Bitcoin is not that asset. And applying DCA to it is one of the most common and costly mistakes I see investors make.
Bitcoin has completed four full market cycles since 2011. Each followed roughly the same pattern: a halving event reduces the supply of new coins, adoption demand accelerates, price appreciates dramatically, leverage builds in the system, then the cycle reverses with drawdowns that have historically exceeded 70%.
Bitcoin (LHS) vs. Drawdowns (RHS)
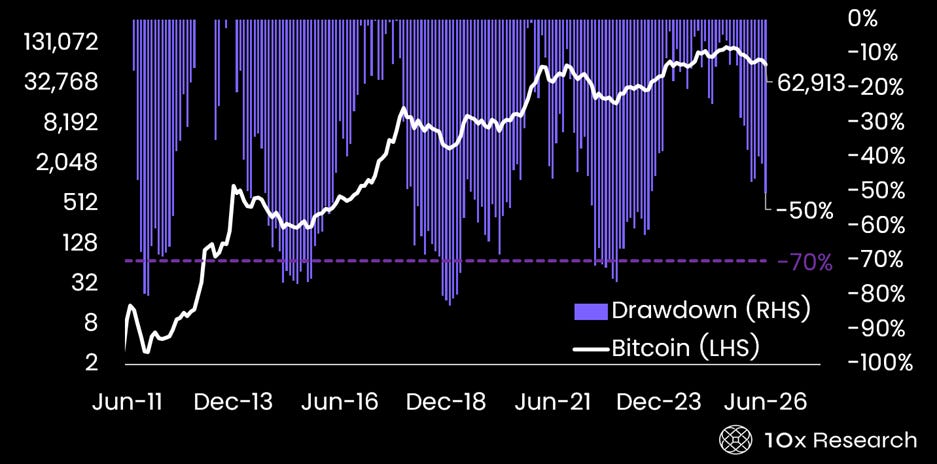
The peak-to-trough drawdown for a buy-and-hold Bitcoin investor across the full history is −70%. That number is not a tail-risk scenario. It happened four times, and it might happen again. No institutional mandate survives it unchanged. The typical outcome: capitulation near the bottom, followed by missing the recovery. The long-run return looks extraordinary on a chart. The lived experience destroys capital.
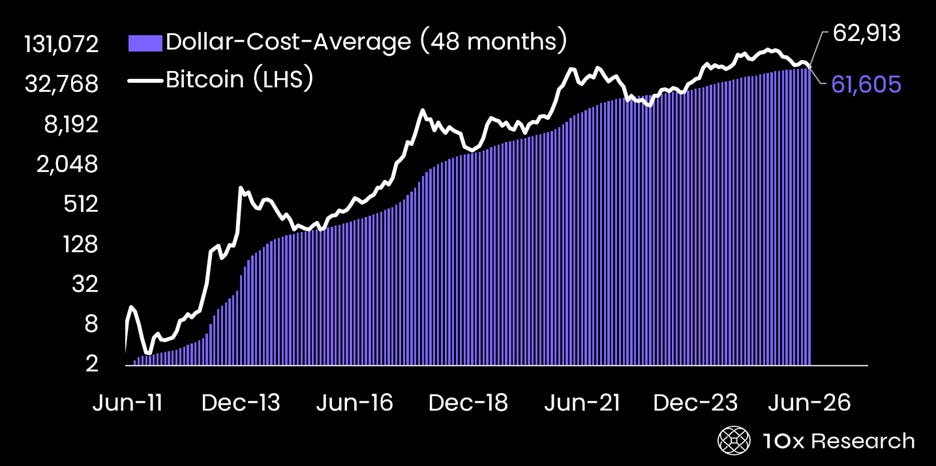
DCA smooths the path only marginally. An investor who bought steadily through the 2021–2022 cycle still experienced catastrophic mark-to-market losses during the bear phase. The strategy offers psychological comfort, not mathematical protection, because it does not reduce exposure when the regime has structurally turned negative. An investor who dollar-cost averaged into Bitcoin every month over the past four years would now hold an average acquisition price of $61,605, barely below today’s price of $62,913.
Curiously, while Bitcoin has historically pulled away from this DCA line during bull market rallies, it tends to mean-revert back to it, effectively erasing the advantage of disciplined, programmatic buying. MicroStrategy offers a similar lesson on a longer timeline: after six years of continuous accumulation, the company’s average cost basis sits at $75,656, 17% above the current price. The takeaway is uncomfortable but clear: blindly buying Bitcoin on a fixed schedule, regardless of price, simply doesn’t work as a standalone strategy.
Bitcoin vs. dollar cost averaging (4 year rolling)
The alternative is not day trading. It is not predicting every top and bottom. It is something more achievable: regime awareness.
Bitcoin spends extended periods, typically 12 to 18 months, in identifiable bull or bear regimes. During bull regimes, the asset compounds at an extraordinary rate. During bear regimes, it loses most of those gains. The key insight is that these regimes are not random. They are detectable in advance using observable data across both price behavior and the on-chain economics of the Bitcoin network.
In our research, we track ten independent signals, spanning momentum, trend, and on-chain cost-basis metrics, that collectively identify the regime. The finding is straightforward: when most signals are positive, Bitcoin’s average monthly return has been +25%. When the majority are negative, the average is -6%. That 31-percentage-point separation between positive and negative regimes is not noise. It is the structure of Bitcoin’s cycle, made measurable.
Bitcoin (LHS) vs. 10x Cycle Model (RHS)
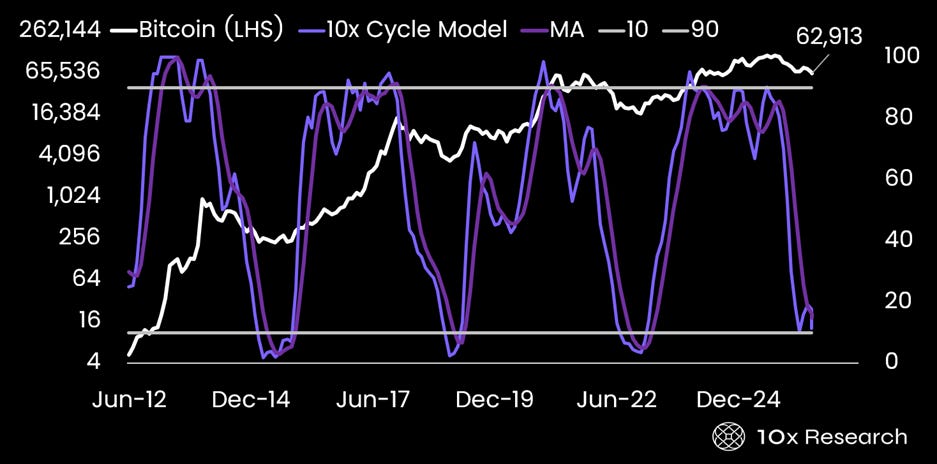
A cycle-aware long-only approach, one that increases exposure when signals align positively and steps aside when they align negatively, has produced a Sharpe ratio of 1.22 in backtesting versus 0.82 for buy-and-hold over the same 15-year period. More importantly, it cut the maximum drawdown from −80% to −44%. For an investor with an investment policy statement or a fiduciary mandate, that difference is what passes a risk committee.
The implication for investors and wealth managers is practical, not philosophical. Bitcoin deserves a place in a diversified portfolio; the long-term return premium is real, and the diversification benefit is measurable. But the allocation framework should reflect what Bitcoin is.
Bitcoin is a cyclical asset driven by a four-year supply schedule, successive waves of institutional adoption, and leverage cycles that amplify both upside and downside. But the number is also deeply rooted in our existence.